Responsibilities //
Stakeholder collaboration
Client Engagement
Research & Synthesis
Prototyping & Iteration
Design System
Team //
1x Product owner
1x Product manager
1x Product designer
Engineering Team
Year //
2022


Problem Highlights
01
Heavy reliance on fragmented spreadsheets and manual scripting
02
Forecasting outputs were difficult to interpret, validate, and communicate
03
Collaboration was disjointed between analysts and business teams
04
The need for a structured, transparent, and repeatable forecasting tool
Users &
Primary Activities
👩💻
Brand Marketers
Shaped and refined campaign plans, explored 'what-if' scenarios, and made sure plans aligned with broader marketing goals.
🤓
Heads of Insight / Analysts
Managed non-media data inputs, validated assumptions, and ensured the numbers reflected what's actually happening in the world.
🧑🔬
Marketing Science Teams
Kept model logic aligned with reality, helped interpret the outputs, and ensured everything held up to scrutiny.
👨💼
Business Stakeholders
Looked at the big picture, comparing options, assessing impact, and making the final calls with more confidence.
Process Highlights
01
Reviewed existing materials, stakeholder feedback, and workflows to understand key friction points
02
Referred to internal documentation and past client reports to gather insights
03
Worked with product leads to keep things simple, understandable, and easy to explain
04
Explored ways to visually show plans side-by-side in a way that feels intuitive
05
Tested flows through quick prototypes and design reviews to refine usability
06
Guided the client through the project with a DesignOps-style document that outlined the design process, responsibilities, and delivery checkpoints
Research & Synthesis
We ran SME workshops and reviewed client input to capture the core needs of two key personas: Brand Marketers and Heads of Insight. Our focus was on identifying their most frequent tasks, what decisions they need to make, and how they navigate forecasting data
Persona Needs
Identifying the needs of two key personas. The Brand Marketers and Heads of Insights, breaking down their workflows.

Aligning on the Right Problems
I worked closely with the product and business stakeholders to turn business goals and user needs into clear design stories.
We used journey mapping and hands-on workshops to agree on what really mattered, shaping the core flows and interactions.
It helped us stay aligned with the value we wanted to deliver and gave the team a shared understanding moving into design and development.

Design
Sketched, tested, and refined product flows, starting lo-fi and evolving into high-fidelity wireframes to shape the approach.

Refined the interface to match brand direction and crafted interactive prototypes to explore flows, gather feedback, and align teams around the intended experience.


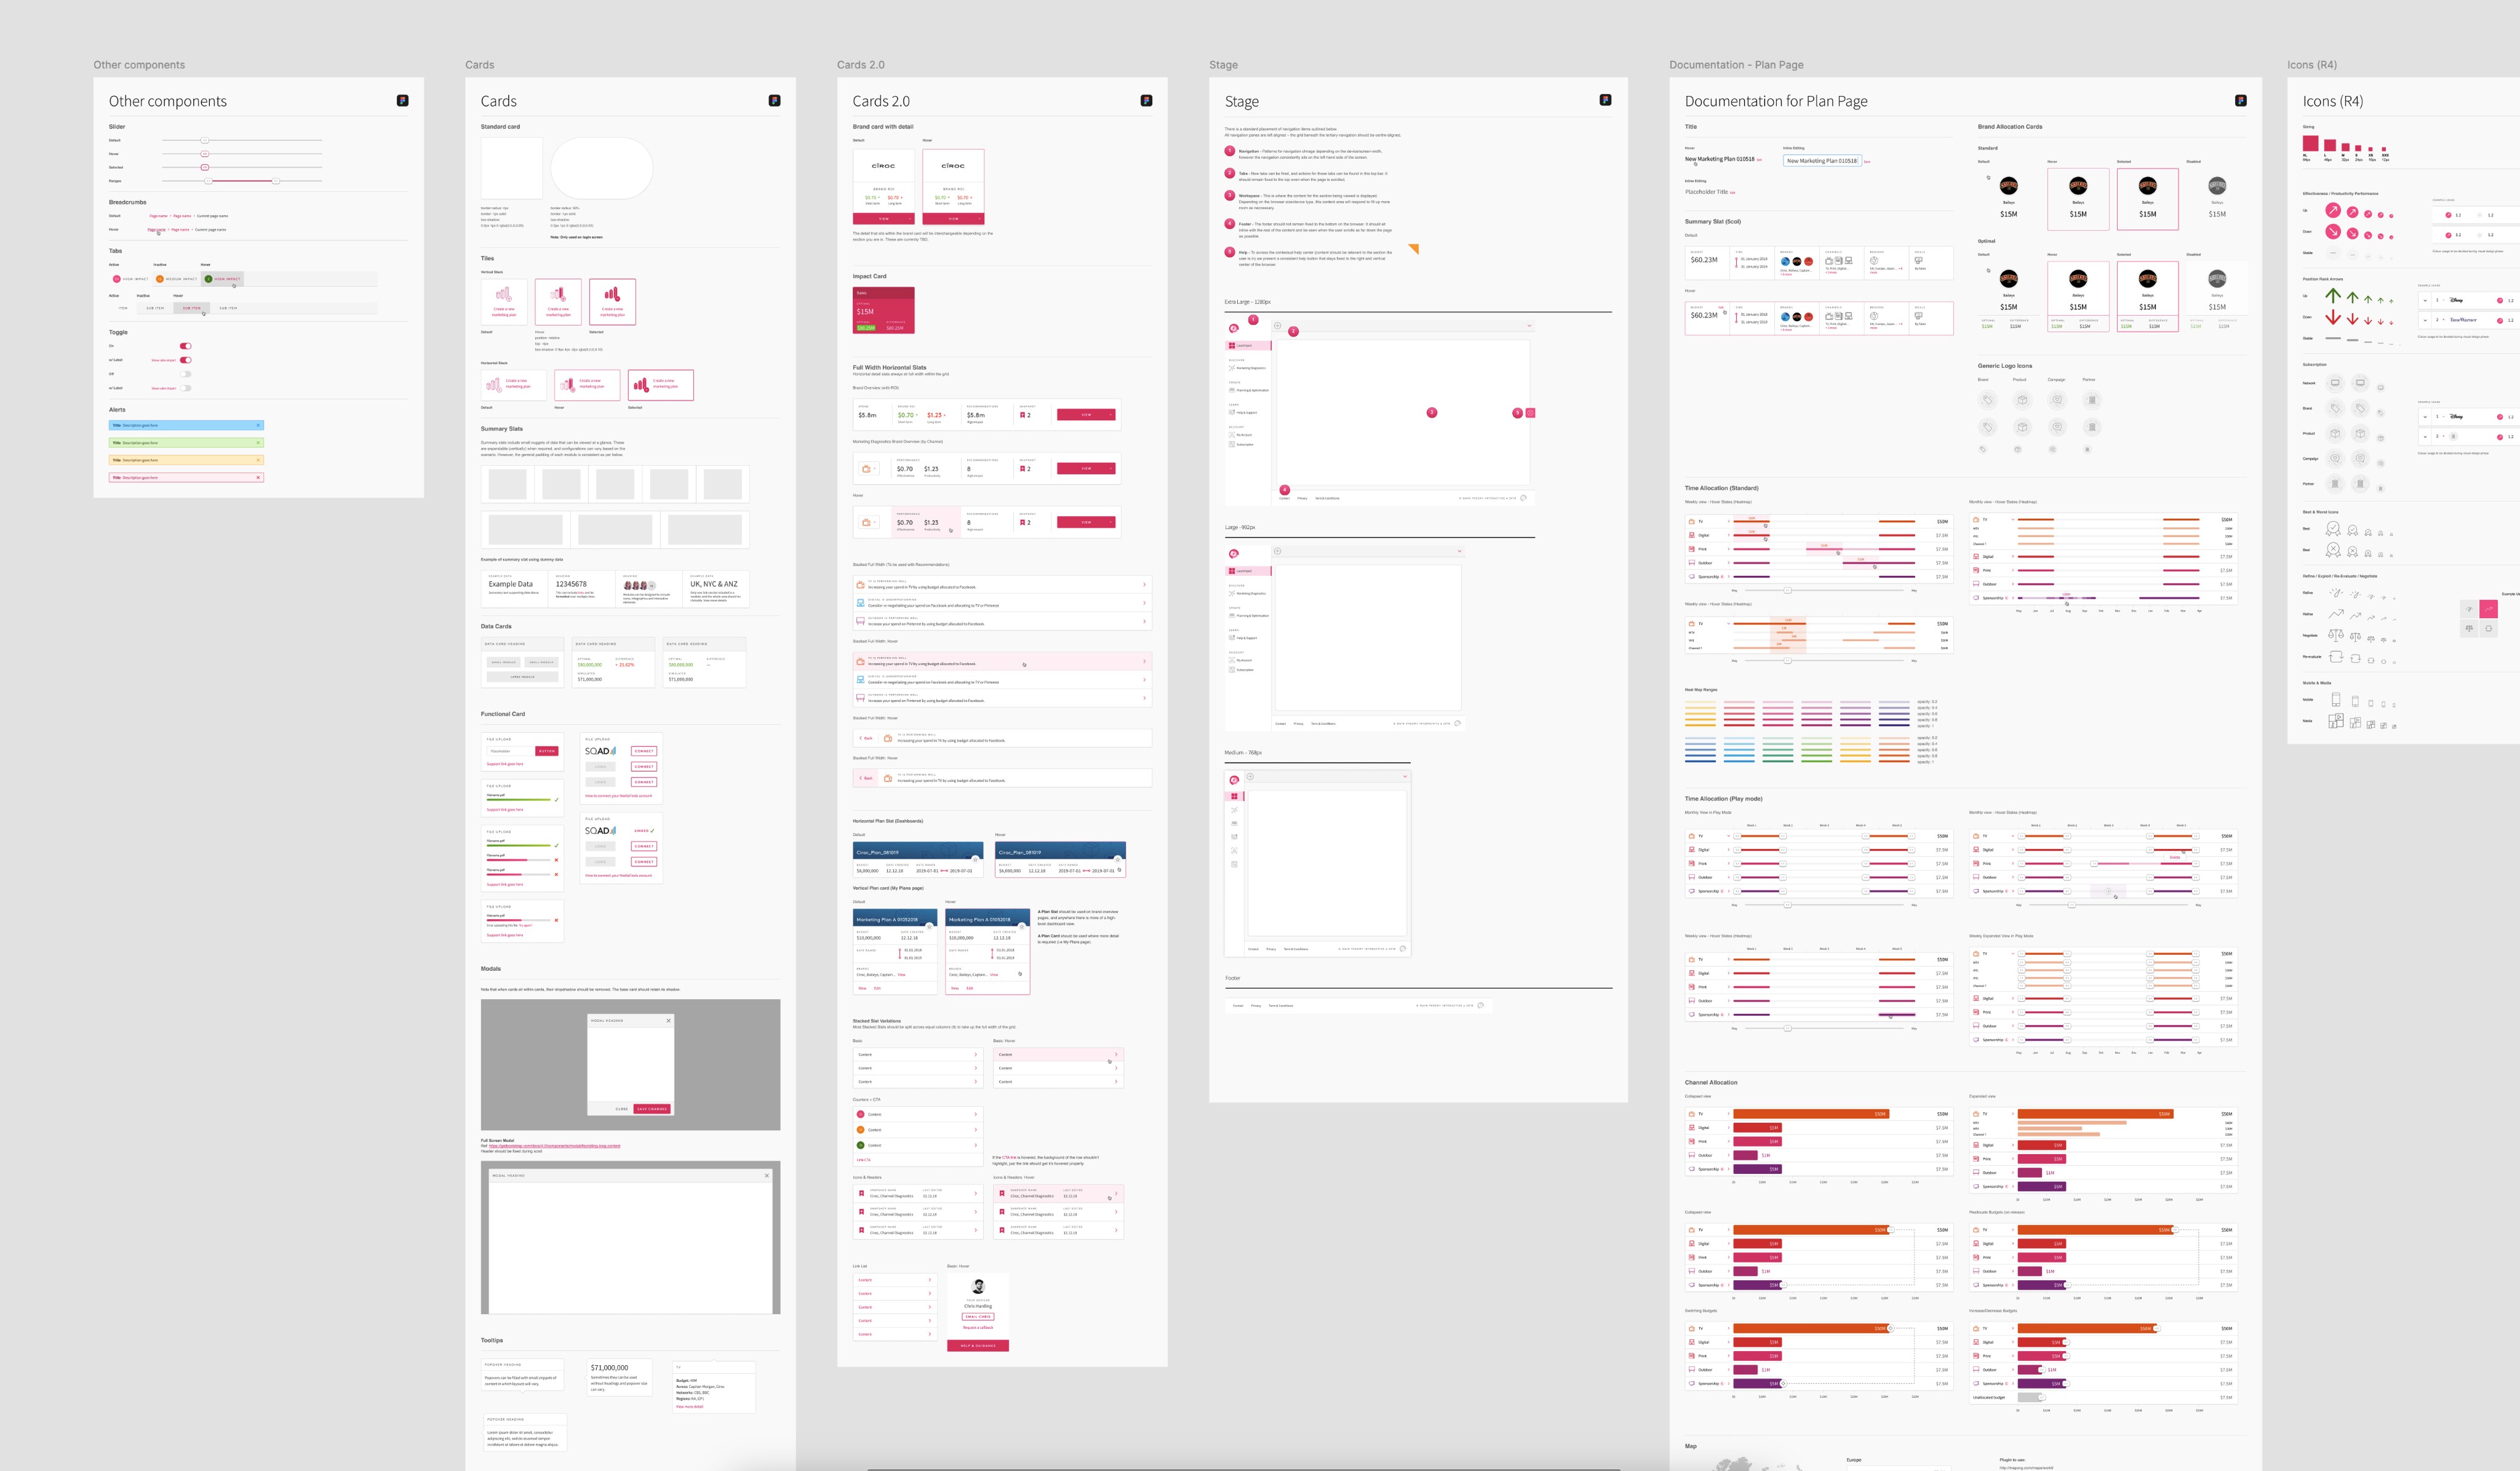
Design System
As part of the final delivery, I created a documented design system with reusable components and UX patterns, ensuring the product could scale and be maintained by the client team beyond handover.
This gave them a solid foundation to continue building new features internally with consistency and efficiency.

Outcomes
01
Replaced disconnected workflows with a structured forecasting workspace
02
Created a shared foundation between analytics and business stakeholders, essentially improving communication.
03
Supported better scenario planning through intuitive UI and clearer impact visibility
04
Provided the client team with a fully documented design system to continue building on the product internally
Reflections
This project was a great example of how thoughtful design can simplify complex, data-heavy processes
By breaking things down into clearer, more visual flows, we made forecasting easier to understand and more collaborative for everyone involved, helping teams work together with more confidence and alignment.